
SOFTWARE
DPlus
All-round and High Performance Data Analysis Software
Our new data analysis software DPlus has been built for (product) engineers with the latest and newest software technologies. It features a modern and intuitive, context-driven user interface and the predefined building blocks help you quickly understand complex data analysis.
The best tool for product and test engineers
Our new data analysis software DPlus has been built for (product) engineers with the latest and newest software technologies. It features a modern and intuitive, context-driven user interface and the predefined building blocks help you quickly understand complex data analysis.
The extensive visualization tools support you to detect data flow and process issues and guide you to focus on conclusions and fast reporting. The tool can handle (very) large data sets and is easy to learn, configure and use.
Addressing your daily data analysis challenges
With its comprehensive set of features, you can address a huge variety of today’s processes in semiconductor test: Detect test environment dependencies by analysing site-to-site variation, equipment variation or by running a full Gage Repeatability & Reproducibility (GR&R) analysis. Validate your production process with comprehensive Cp/CpK or test fault analysis or use DPlus for part characterization.
The tool can also be used during instrument development for design verification and characterization purposes, by performing board-to-board and channel-to-channel performance verification analysis.
The DPlus Process
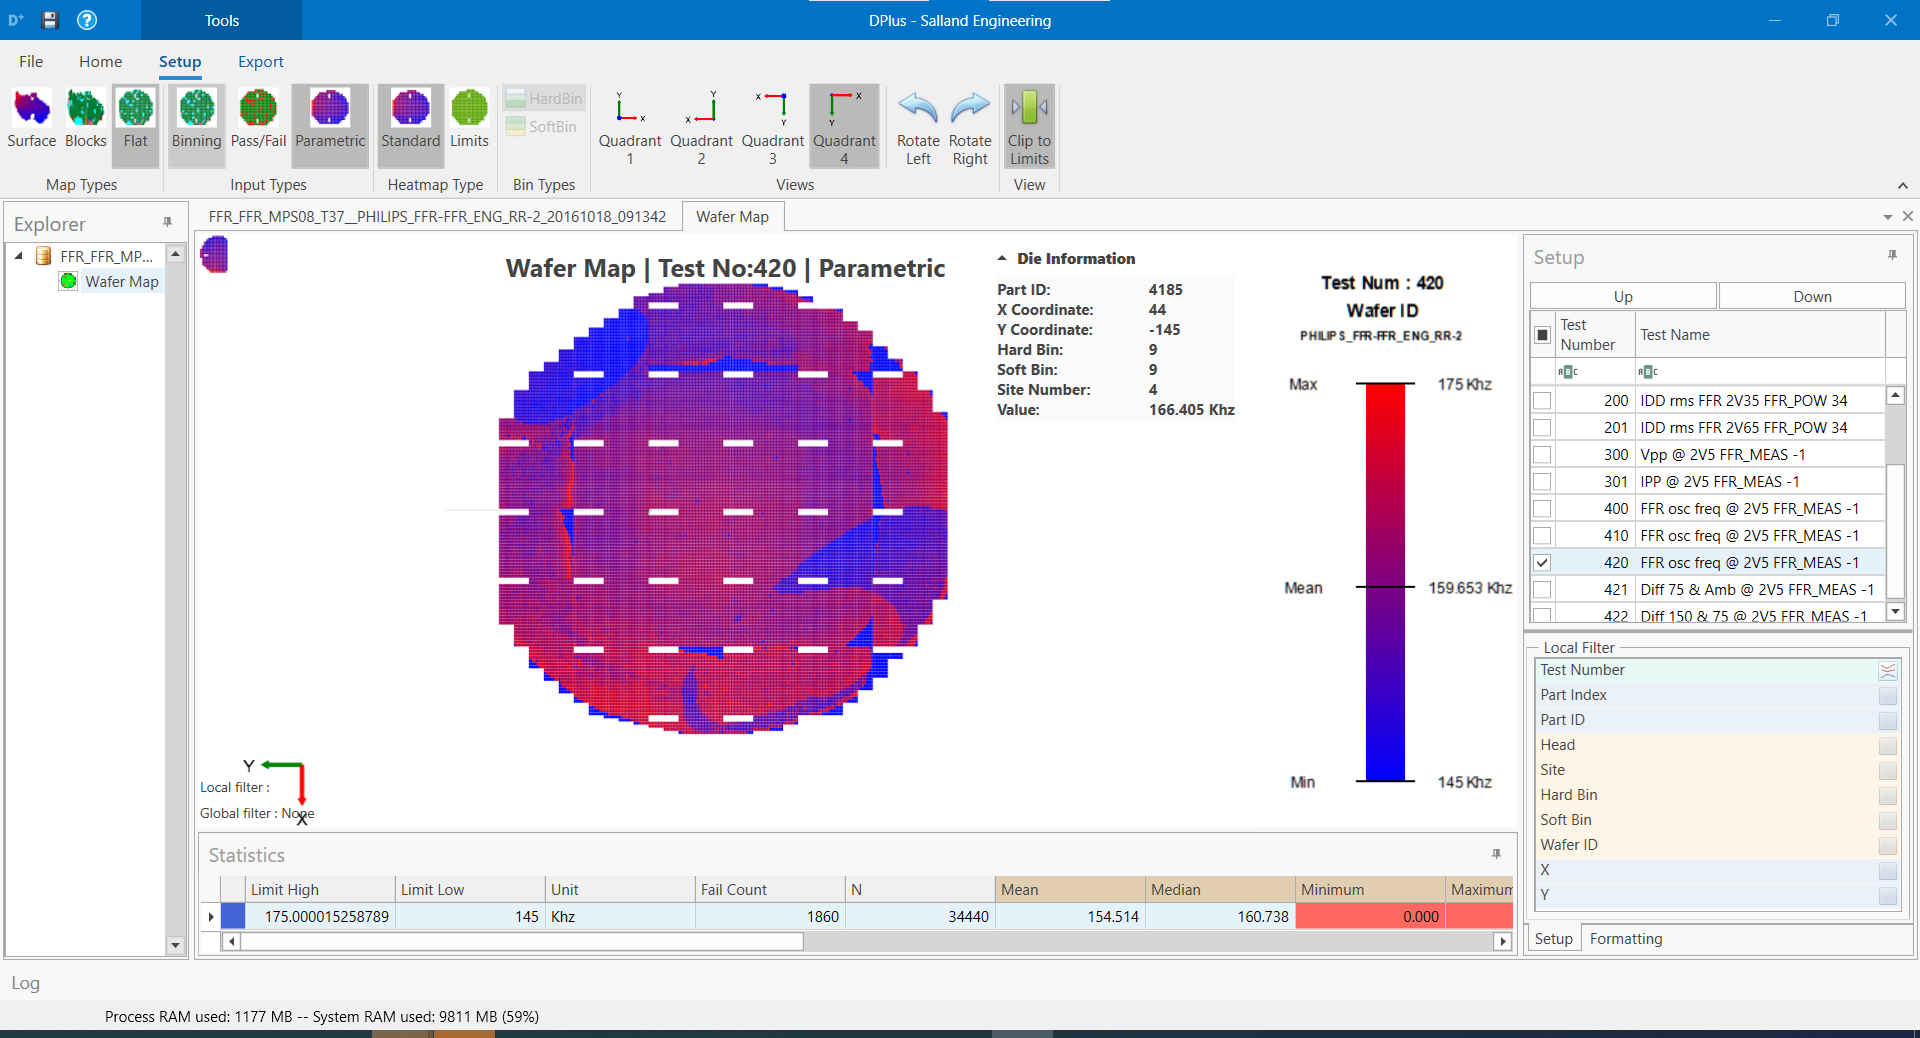
DPlus can load and process test data from all major platforms in commonly used formats, such as STDF, STD, TDF, CSV and LOG. When interpreting your data, you always want to follow a transparent and comprehensible process.
DPlus enables you to be in total control of how the data is being processed and analysed. The building blocks architecture and Explorer panel let you easily configure the process to meet your data analysis requirements and workflow. Once you have configured your workflow, you can visualize your data by means of tables and charts with a variety of local filter options to quickly pinpoint the area(s) of concern.
At the end of the day you can save all information and your workflow as a project and import new data sets to re-run your analysis wherever and whenever you want.
- Add dataset(s) in STDF, CSV, LOG, STD, TDF and other formats
- Create groups of datasets for detailed GR&R analysis
- Replace and merge data and dataset(s)
- Configure (general) settings for charts, tables, ribbon and menu items
- Apply filters on complete datasets or on specific tests and parts to make sure you only work with useful data
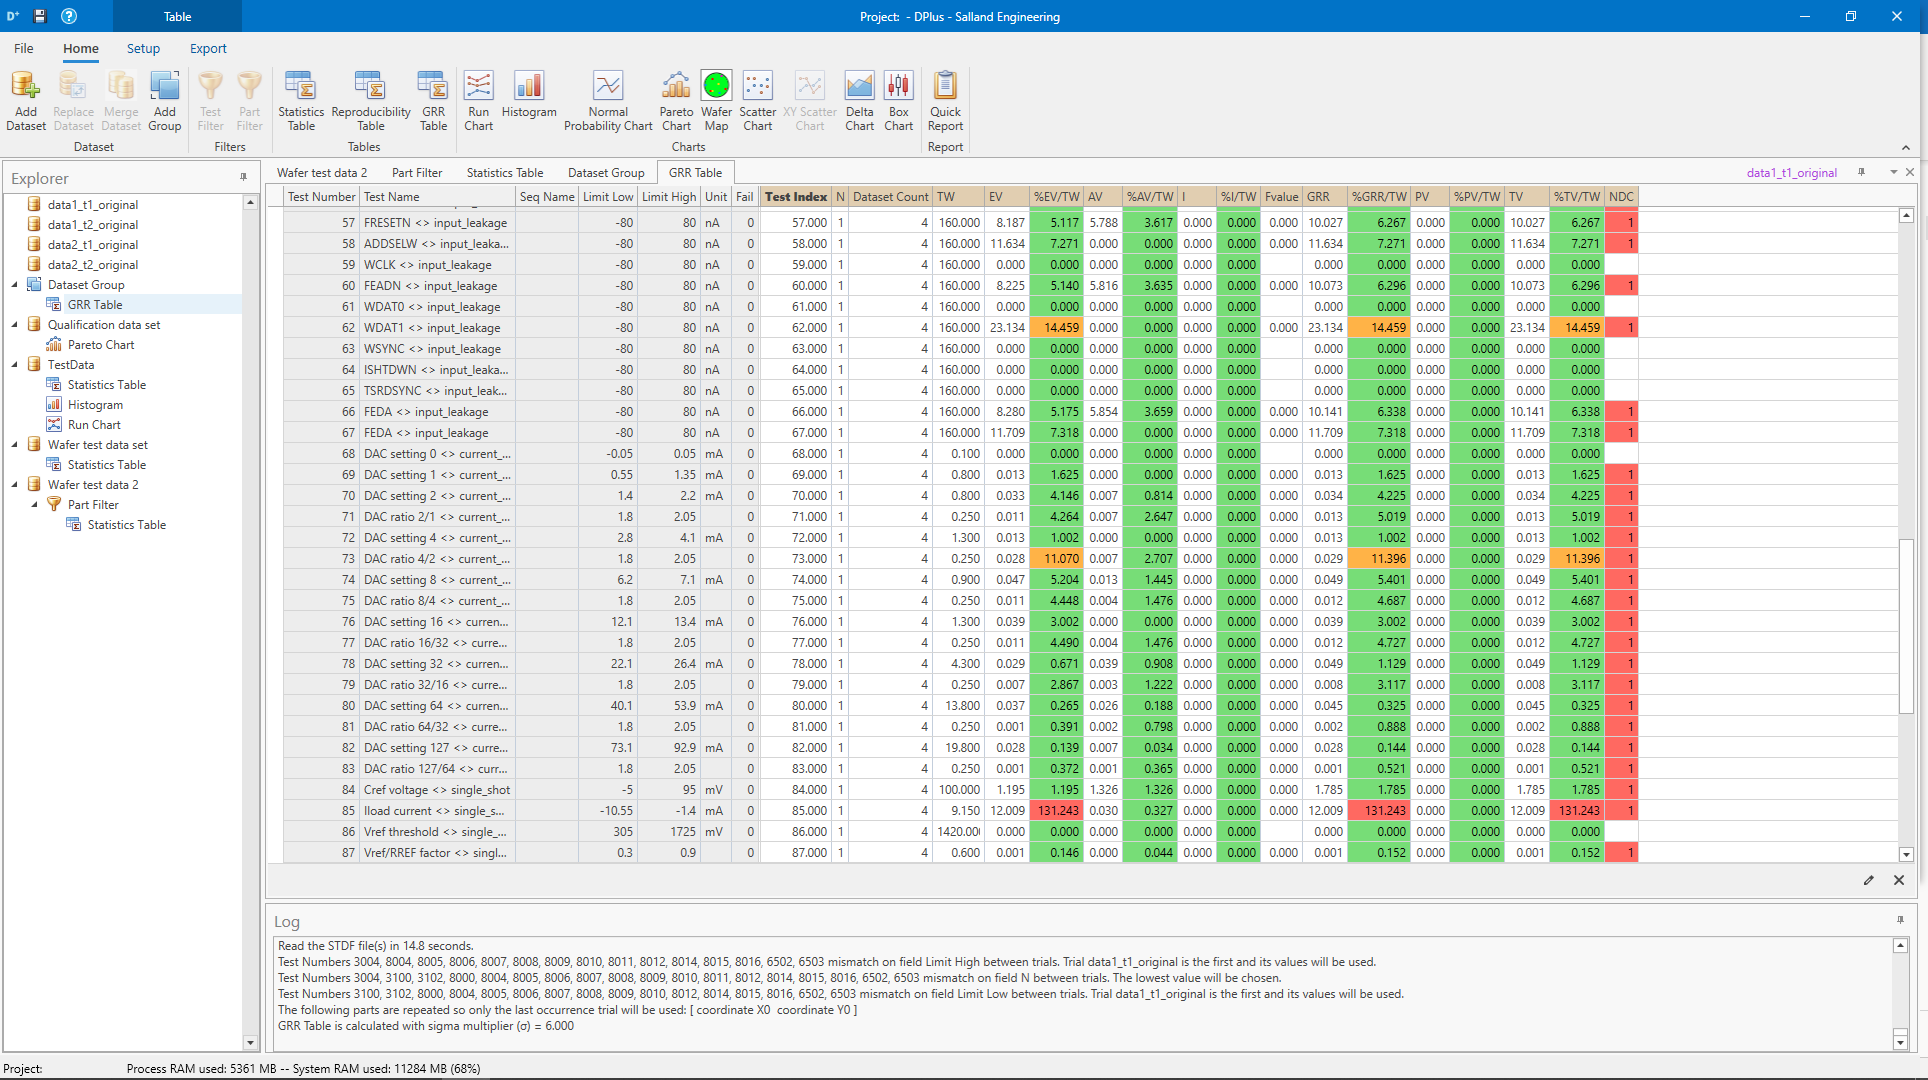
- Create tables to pinpoint (an report) the area(s) of concern
- Raw data table
- Capability table
- Repeatability table
- Reproducibility table
- GR&R table
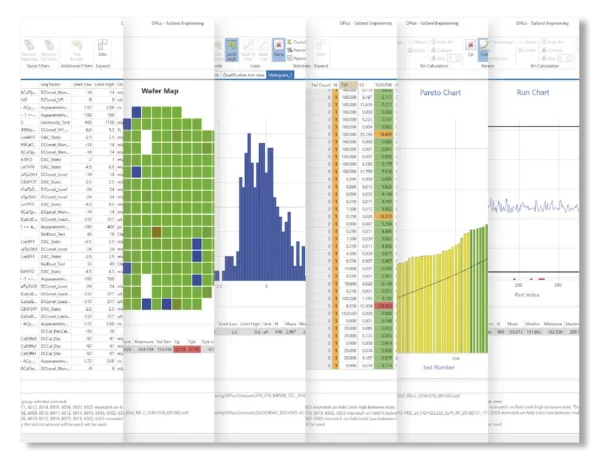
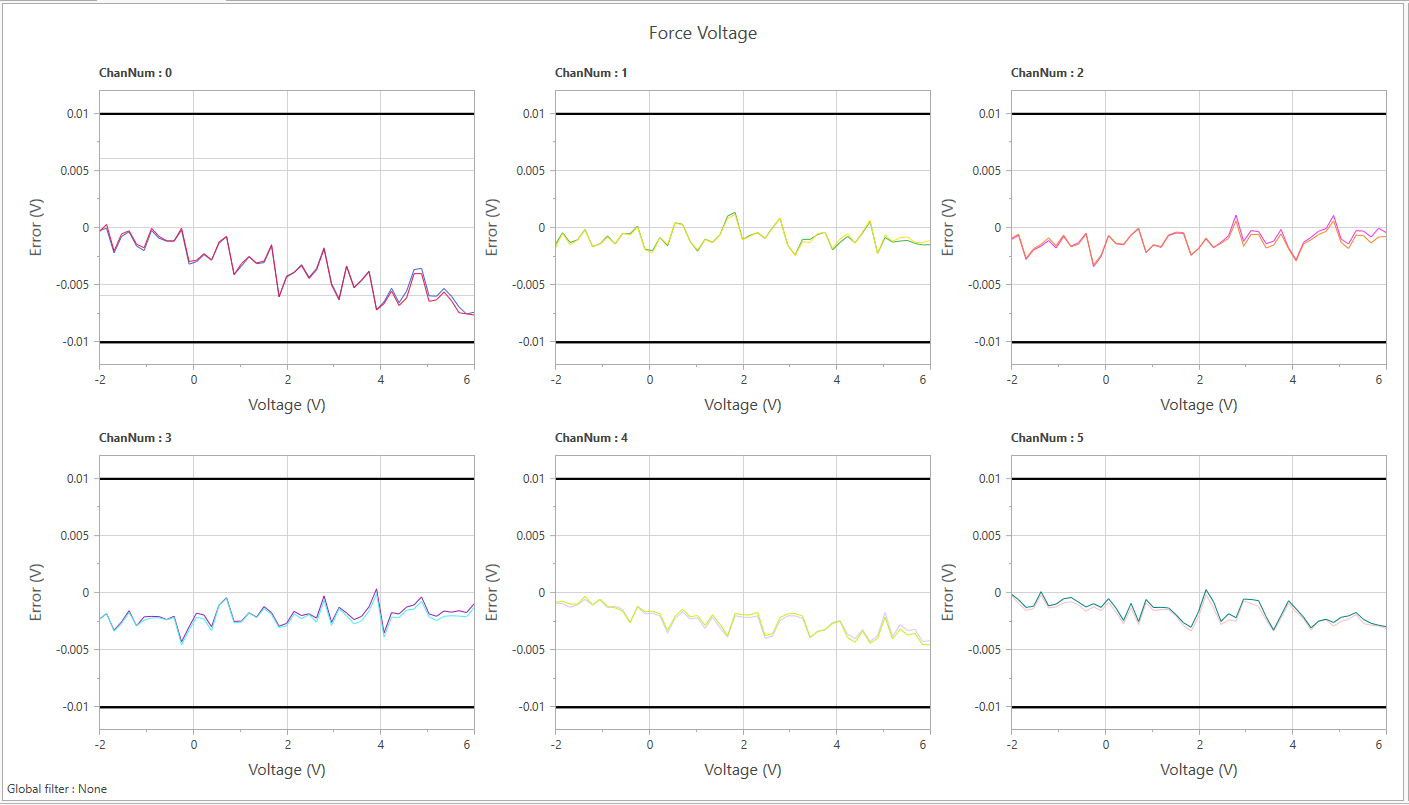
- Create charts to visualize (and report) the results of your analysis
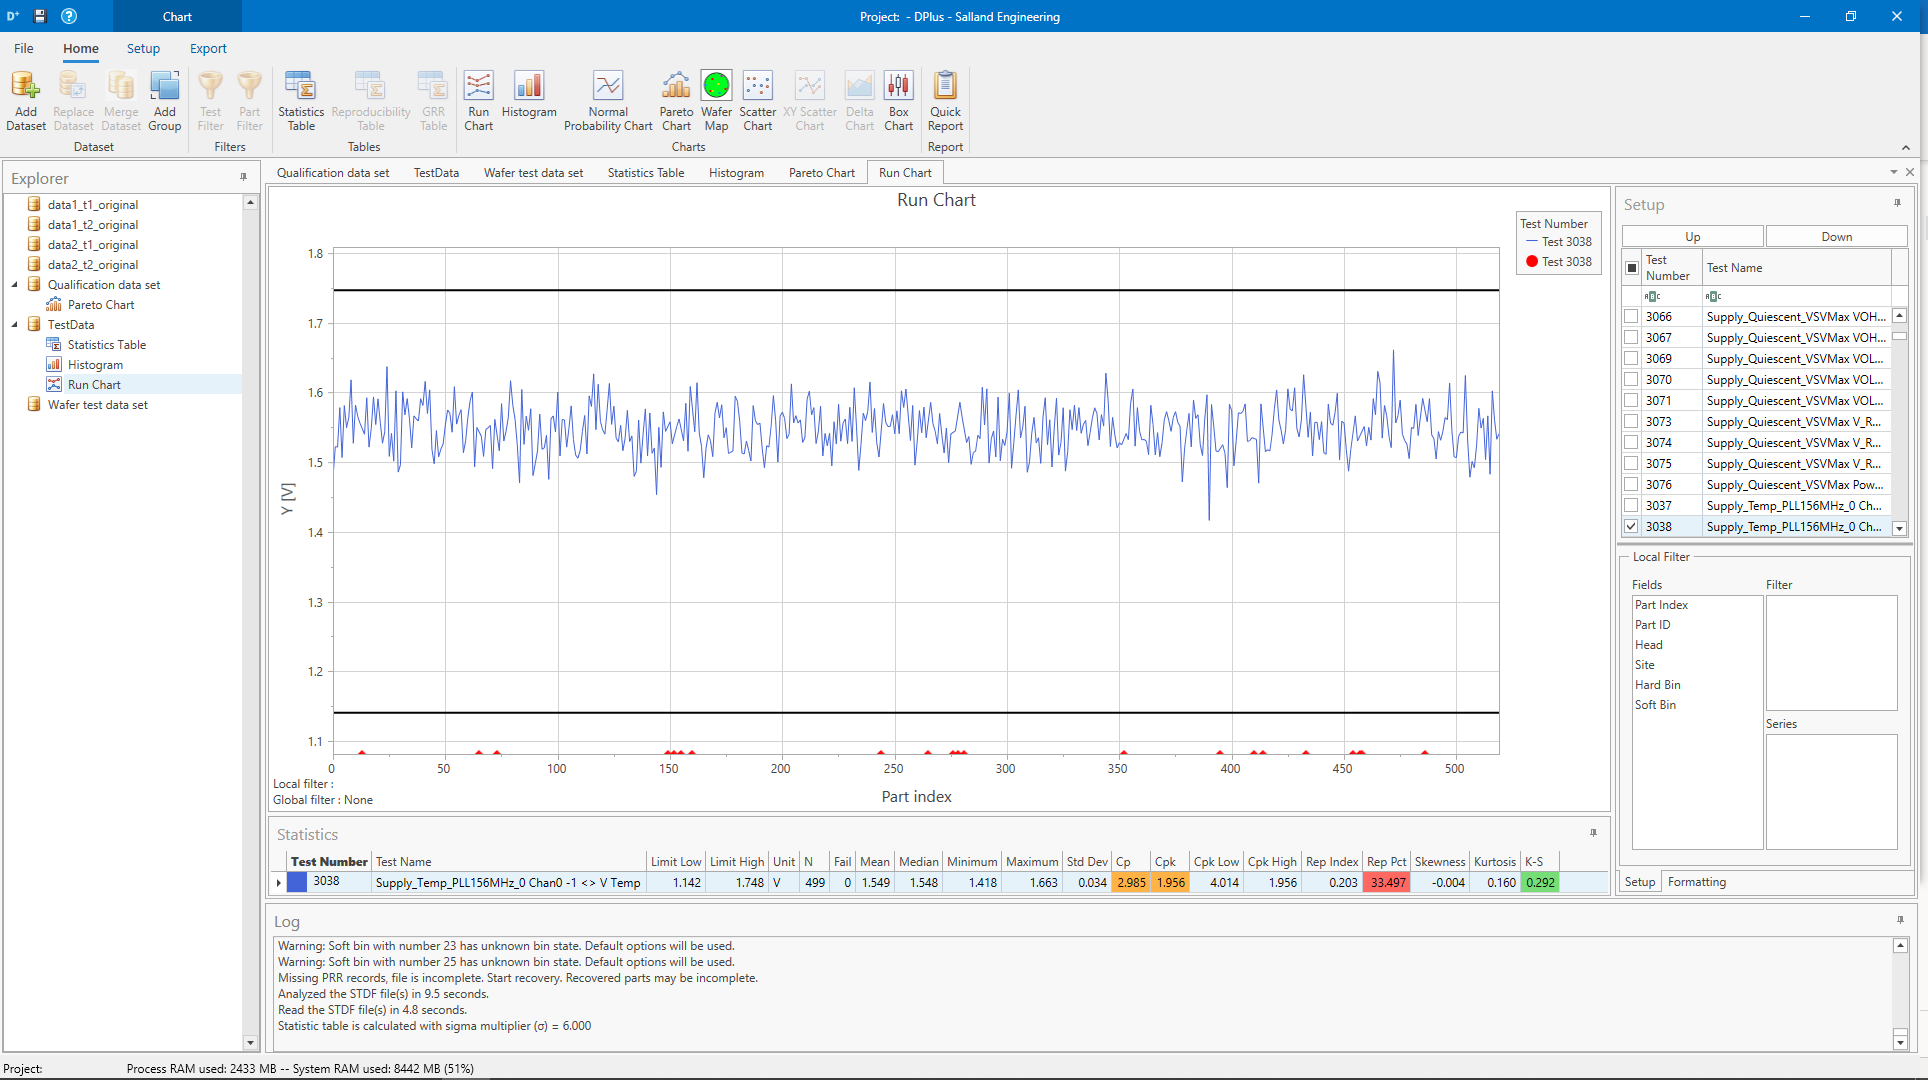
- Run/Trend chart
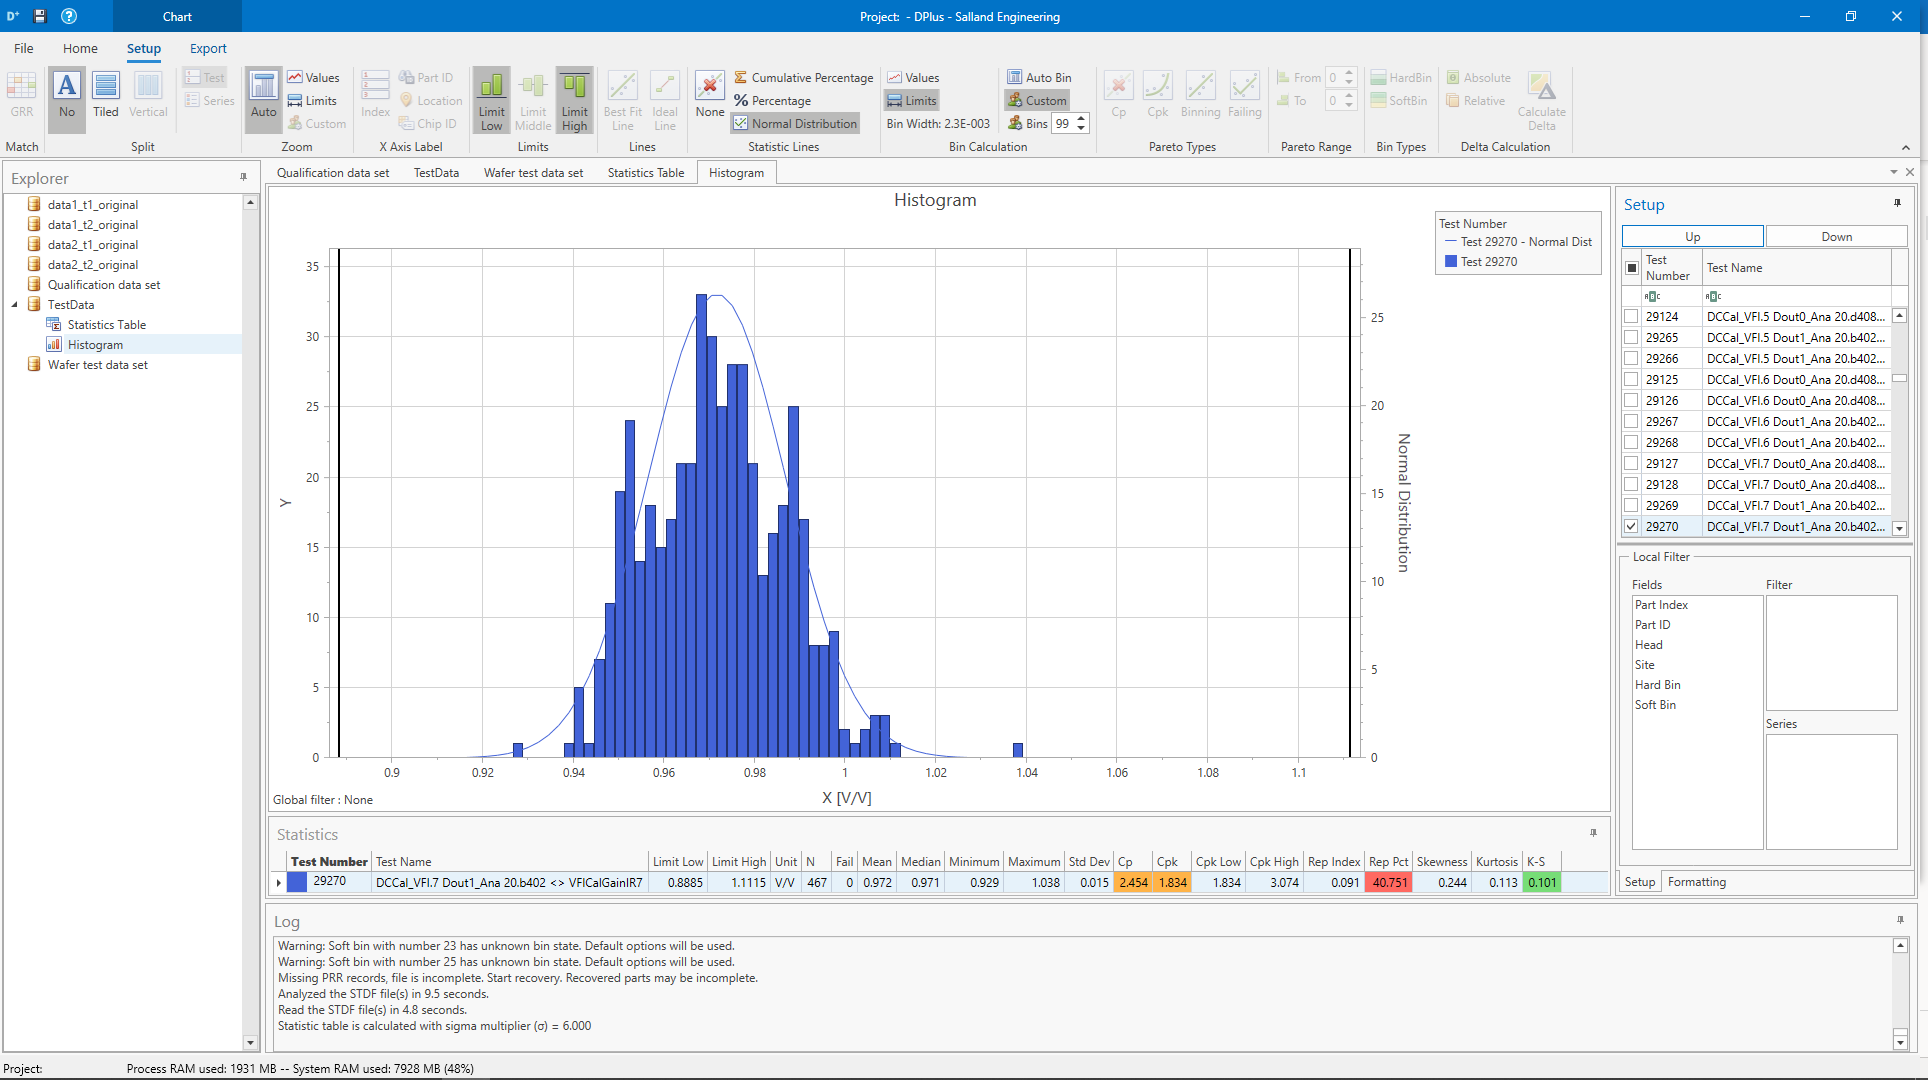
- Histogram
- Normal Probability chart
- Pareto chart
- (stacked) wafer map
- Box chart
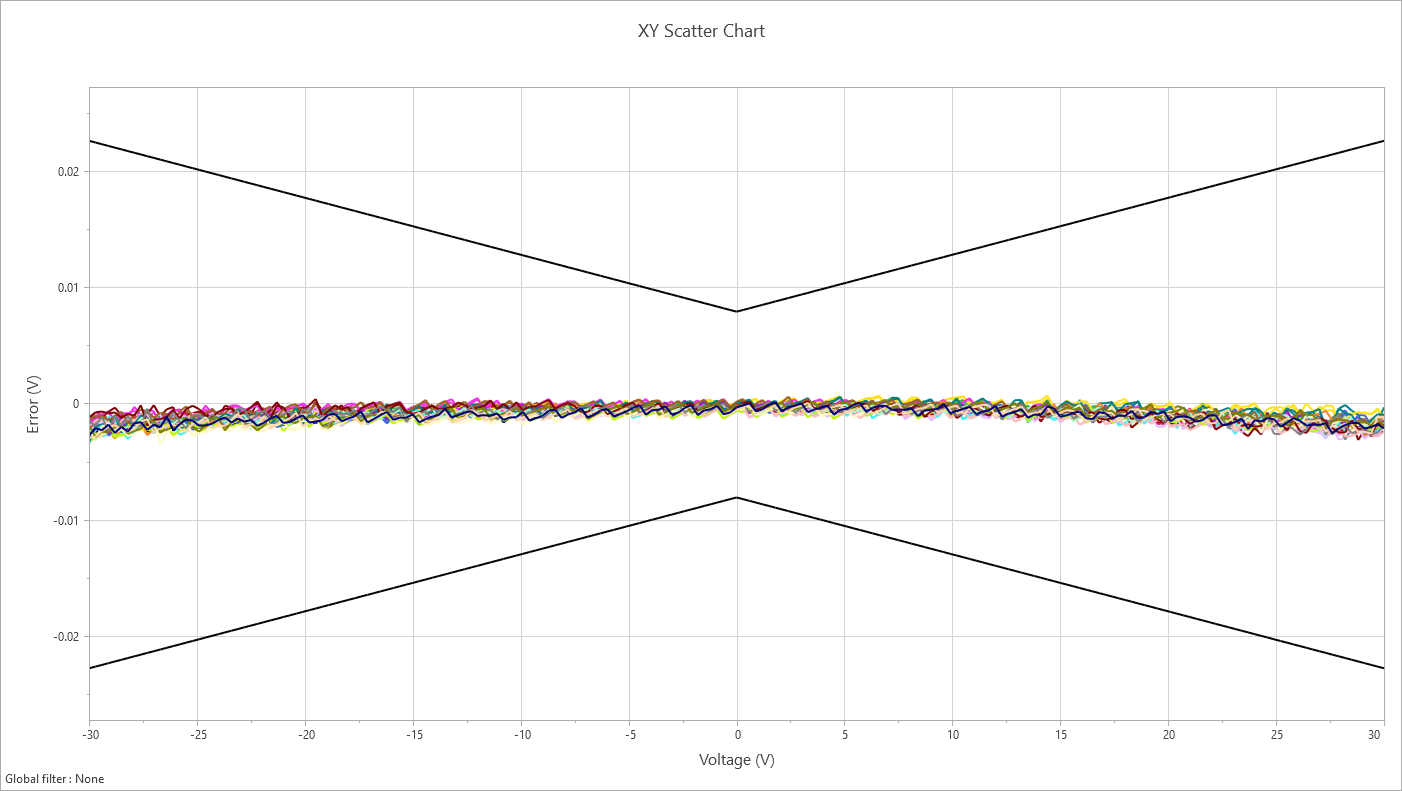
- (X/Y) scatter chart
- - Delta chart
- Each table or chart can be adjusted to your own specific needs
- Export your (filtered) data to STDF, CSV, TXT or XLSX for further distribution
- Export charts as images
- Quickly create a report in MSword to summarize the results of your entire project
DPlus version 1.5 available
DPlus 1.5 is the latest version of our tool and it is packed with features to make your daily analysis much easier and more efficient.
Important note: DPlus version 1.5 only supports Windows operating systems version 10.0.17763.0 and higher; for full details on upgrading instructions, please download and read the Release Notes.
Interested? Download the trial version now!
To download DPlus and request a 30 day trial license, please fill out the form below. After that you will receive an e-mail with further instructions.
Key Features
- Fast tool capable of handling large datasets
- Predefined building blocks for fast analysis and reporting
- For test process validation and instrument design verification
- Modern, intuitive and context driven user interface
- Quickly pinpoint the area(s) of concern
- Clear visualization of data flow and process issues